


5. Car costs
Level
To follow this lesson you need basic knowledge of Excel.
You can already work with formulas to some extent, and copying and pasting is no problem for you either.
Comparing car costs
In this lesson you will learn how to fix cells in formulas and how to create charts.
Download the Car costs file, or create your own car costs file as shown below.
A number of fields are still empty; we will be entering formulas in these.
Cell C17 calculates the VAT.
Click on cell C17
Type =C15*C9 in the cell
Figure 5.1 The Car costs file
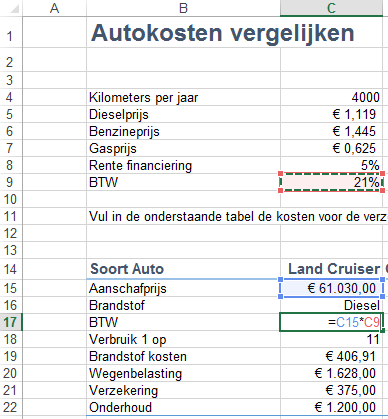
The VAT is the same for all cars, so cell C9 can be fixed, allowing us to use this formula for the other cars as well.
Click on C9 in the formula bar

Then press the F4 key; $ signs are placed in cell C9
The $ signs mean that when you copy the formula, cell C9 must not change along with it.

Press Enter
The answer will appear in cell C17
Copy the answer into cell C17
Select cells D17 to J17
Paste the formula into the cells
Figure 5.2 Calculating VAT

The VAT has been calculated; we will now create a formula to calculate the financing.
Now that the costs for the cars are known, we can calculate the total costs per year.
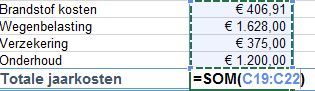
In cell C23, you enter a formula to calculate the costs per year.
Place your cursor in cell C23
Click the SUM button 
Select cells C19 to C22
Figure 5.3 Calculating the annual costs with SUM
Press Enter
The answer for the total costs of the Land Cruiser is now in cell C23
Copy this answer to cells D23 to J23
Figure 5.4 Total annual costs 
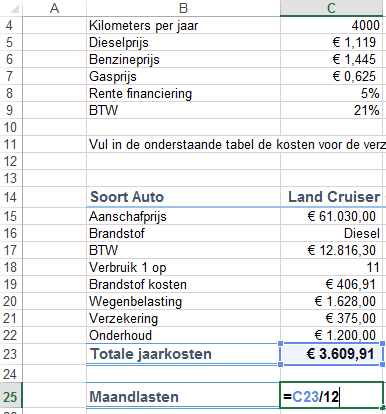
Now that the Annual costs have been calculated, the Monthly costs can be calculated as well.
In cell C25, create a formula to calculate the monthly costs.
Figure 5.5 Calculating monthly costs
Charts
The overview of the car costs is now complete.
To see clearly which cars are the most economical, we will add two charts.
Select cells B14 to J15
Figure 5.6 Selecting 
Go to the Insert tab
Figure 5.7 Insert tab 
Click the Recommended Charts button
Figure 5.8 Recommended Chart 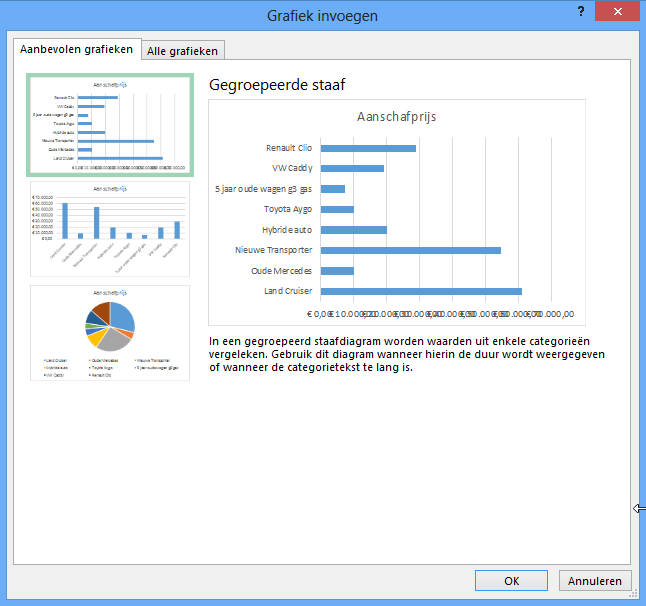
You can move the chart by dragging it with the mouse
Figure 5.9 Purchase price chart
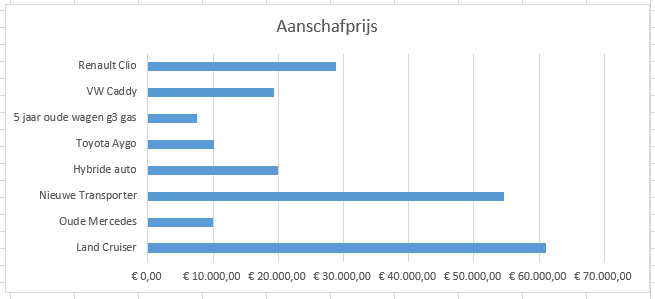
We will also create a chart of the Monthly costs
Select cells B14 through J14
Hold down the CTRL key
Select cells B25 to J25
Figure 5.10 Selecting monthly costs
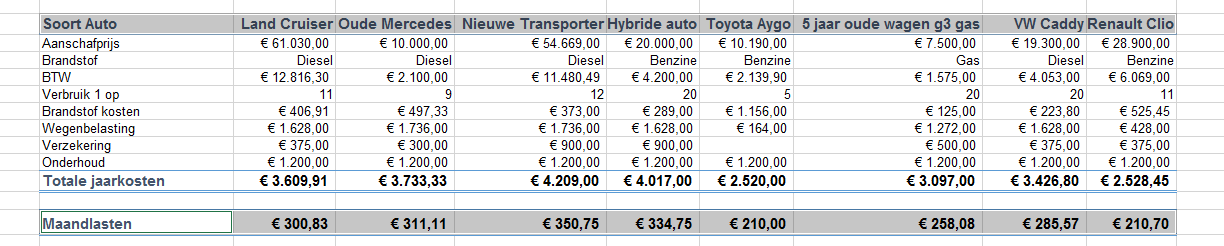 Choose a 3-D column chart
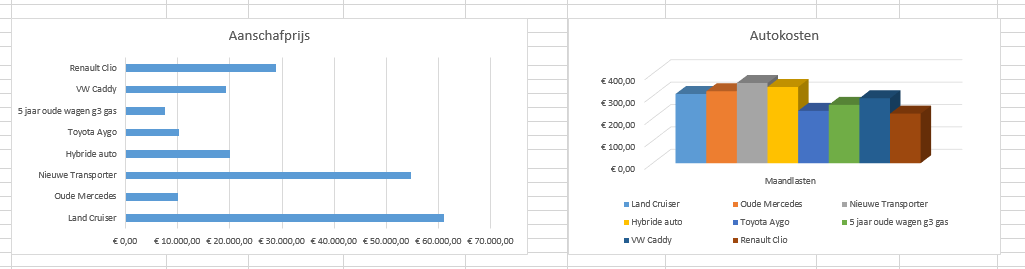
Place the charts neatly below the car costs table
What happens if the number of kilometres per year is changed to 5000?
Figure 5.14 The result
Page Layout, selection pane
If you do not want to display or print the charts for the time being, you can switch them off temporarily.Go to the PAGE LAYOUT tab and click the Selection Pane button on the right-hand side
Figure 5.15 Selection Pane
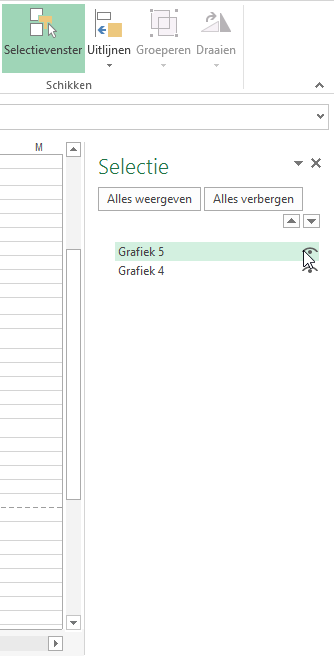
(Note: the names of the charts in your Excel file may differ)
