


4. Calculating the critical path
A list of work packages tells you what needs to happen, but not when. Network planning sets the sequence and works out how long your project will actually take. This is the chapter that calls for pen and paper: in the exam this is nearly always an open question based on the case study, and the marks are just as much in your intermediate steps as in your final answer.
After this chapter you can:
- Derive an activity list from your Work Breakdown Structure.
- Name and apply the types of dependency between activities.
- Filling in the six fields of an activity node.
- Determine the critical path using a forward and a backward pass.
- Calculating total and free float and using them to adjust your plan.
- Determining an expected duration with a PERT three-point estimate.
From work package to activity list
You start with the bottom layer of your Work Breakdown Structure. You break each work package down into activities: units of work with a start, a duration and an end. Where a work package is called "Test environment delivered", your activity list contains lines such as "Order hardware", "Install servers" and "Load test data".
You do this in five steps. Carry over all work packages, because the WBS is your source and that way you can be sure you haven't forgotten anything. Break each work package down into activities and carry on until every activity has one clear person carrying it out and one clear end point. Estimate the duration of each activity, and note: duration is lead time in working days, not the number of hours of effort. Twenty hours of work by someone who is available for half days takes five days. Give every activity a code, because a short letter or number code keeps the network diagram readable. And determine the direct predecessors for each activity: only the activities that immediately precede it, not the entire chain before that.
That last step is the hardest and at the same time the core of your network. For each activity you ask what has to be finished before it can start, not what happens to take place earlier.
It is best to keep your first network to thirty or fifty activities. Larger networks can no longer be drawn by hand and you quickly lose sight of them. For a large project you make a separate network per phase or per subproject and link those together via milestones.
Dependencies in the network
The syllabus distinguishes four types of dependency and works out three of them. In by far the most cases you use Finish-Start: the successor only starts once the predecessor is finished. This often results in an unnecessarily long schedule, because in practice activities partly run in parallel.
With Start-Start lets your work overlap. The user documentation can start as soon as the build has begun, even though the build is nowhere near finished. With Finish-Finish you agree that two activities finish together, for example when the acceptance test may only be completed once the last bug fix is included.
Besides the type, you sometimes specify a lag. A lag is waiting time between two activities: after 'Pour concrete' there is a lag of seven days' drying time before 'Finish floor' can start. A lead is the reverse and actually lets the successor start earlier.
A team is planning the migration of a customer system. "Testing" was initially placed as a Finish-Start after "Converting data", twelve days in total. By changing it to Start-Start with a lag of three days, testing begins as soon as the first dataset is in. The lead time drops to eight days, without a single extra hour of work being added. Four days gained at no cost: that is the kind of answer a case question is looking for.
The six fields of a node
Once your network is complete, you work out the minimum duration of the project and which activities determine that lead time. You do this in two passes: first from left to right through the network, then from right to left back again.
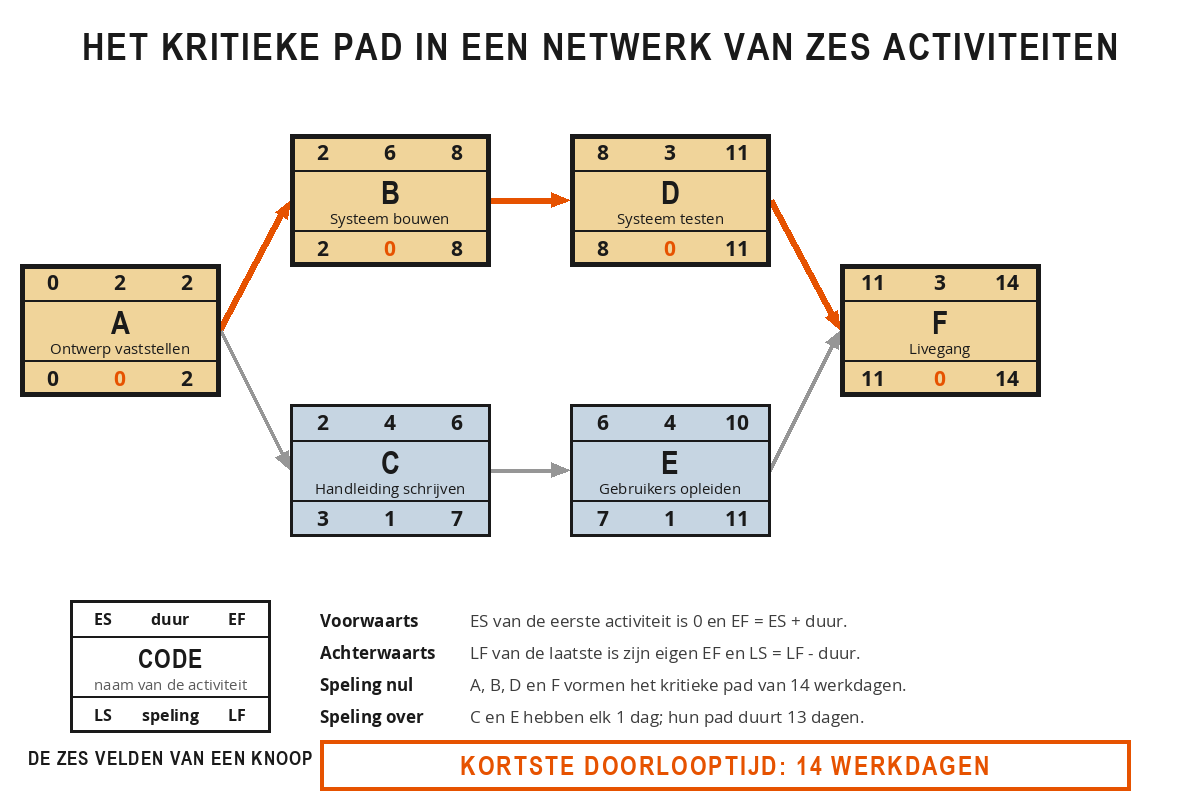
Each node has six values. The earliest start (ES) and the earliest finish (EF) indicate the earliest an activity can run. The latest start (LS) and the latest finish (LF) indicate the latest that activity can run without shifting the end date. The node also contains the duration and the float. In the diagram below, ES, duration and EF are on the top line of each box, and LS, float and LF on the bottom line.
The forward pass
The forward pass runs from the starting activity to the end and produces the earliest dates. You give the first activity ES = 0; that is the start of day 1. You then calculate EF using EF = ES + duration. When you move on to the next activity, its ES equals the EF of the predecessor. If several arrows come into an activity, take the highest EF of all predecessors, because the work can only start once the last predecessor is finished. You repeat this until you reach the final activity. Its EF is the shortest possible lead time for the project.
The backward pass
Then you turn around: you start at the last activity and work back to the start, to determine the latest dates for each activity. You give the last activity an LF equal to its own EF; that fixes the end date. Then you calculate LS with LS = LF - duration. If you go back to the predecessor, its LF equals the LS of the successor. If several arrows leave an activity, take the lowest LS of all successors. You repeat this until you are back at the start activity. That should come out at LS = 0; otherwise there is a calculation error somewhere. That is your free check, and on the exam it is worth the ten seconds.
The network worked out
The network in the diagram above has six activities. A is "Approve design" and takes 2 days. After that the path splits: B is "Build system" and takes 6 days, C is "Write manual" and takes 4 days. B is followed by D, "Test system", 3 days. C is followed by E, "Train users", 4 days. D and E both lead to F, "Go-live", 3 days.
Calculated forwards: A starts at 0 and finishes at 2. B starts at 2 and finishes at 8, C also starts at 2 and finishes at 6. D starts at 8 and finishes at 11, E starts at 6 and finishes at 10. Two arrows come in at F, with EF 11 and EF 10, so F starts at the highest of these: 11. F finishes at 14. The shortest possible lead time is therefore 14 working days.
Working backwards: F gets LF 14 and therefore LS 11. D gets LF 11 and LS 8, E also gets LF 11 but LS 7, because E takes 4 days. B gets LF 8 and LS 2, C gets LF 7 and LS 3. A has two successors, with LS 2 and LS 3, so A takes the lowest: LF 2 and LS 0. The check works out.
The critical path is the longest continuous chain through the network and therefore determines the lead time. You recognise those activities by their float of zero: ES and LS coincide. Here they are A, B, D and F, together 2 + 6 + 3 + 3 = 14 days. If one of those activities overruns by a day, the delivery date moves by a day. The other path, A-C-E-F, takes 2 + 4 + 4 + 3 = 13 days and therefore has a day of room. Every network has at least one critical path, sometimes several at once.
Using float
Float is the number of working days an activity can start later or take longer before the project runs into trouble. That room is not waste, but manoeuvring room that you use deliberately. There are two types you want to keep apart.
The total float is the room available before the project's end date shifts, calculated as LS minus ES. In the network above, activity C has a total float of 1 day: LS is 3 and ES is 2. The free float is the room available before the earliest start of the direct successor shifts, calculated as the lowest ES of the successors minus its own EF. C has a free float of 0, because E starts immediately after C: E's ES is 6 and C's EF is also 6.
If C uses up its total float of one day, the project still meets the end date, but E does have to move by a day. You then consult whoever is carrying out E. If E uses its own float, nobody notices a thing. That difference is precisely why you keep the two types apart.
Float belongs to the path, not to the activity that uses it up first. If the first activity in a chain consumes all the float, the rest of that chain is suddenly critical. So alongside the critical activities, you also monitor the paths with little float. In practice, a path with two days of float in a six-month project is just as sensitive as the critical path itself.
A project manager sees that the critical path is at risk of overrunning by three days. On the parallel path there is a tester with four days of total float. She moves that tester to a critical testing activity for two days. The critical path is brought back on schedule, and the parallel path still has two days of float left. Not a single extra euro went into the project; capacity simply moved from a path with room to a path without.
Estimating with PERT
A single duration estimate suggests a certainty that is not there. PERT asks for three estimates per activity and weights them into a single expected duration. Optimistic (O) is the duration if everything goes well: no waiting time, everything available, no rework. Most likely (M) is the duration under normal circumstances, with the usual minor setbacks. Pessimistic (P) is the duration if things go badly wrong, without assuming a disaster that would halt the project altogether.
You calculate the expected duration with te = (O + 4M + P) / 6. The most likely estimate therefore carries four times the weight of the extremes. You express the spread as a standard deviation: sd = (P - O) / 6.
Take a testing activity in another project. The person carrying it out says 6 days. Optimistically it could be done in 4, pessimistically it runs on to 14. Then te = (4 + 24 + 14) / 6 = 7 days. That extra day above the estimate of the person doing the work comes from the long tail on the pessimistic side: things can only turn out two days better, but eight days worse. That applies to virtually all project work, and it is the reason optimistic plans are so persistent.
You use the standard deviation to say something about how certain your end date is. Add up the variances, that is sd squared, of all activities on the critical path and take the square root. With a project duration of 40 days and a combined standard deviation of 3 days, there is roughly a 50 per cent chance that you will be finished on day 40, and roughly an 84 per cent chance that you will be finished on day 43. That second statement is the sort of thing you want to be able to say in a steering group.
Take a work package from one of your own projects and work through the calculation.
- Activities: split the package into four to eight activities, each with a code and an estimated duration in working days.
- Predecessors: for each activity, note the direct predecessor or predecessors.
- Forwards: calculate the ES and the EF for each activity and note the shortest possible lead time.
- Backward: calculate the LS and the LF for each activity, working back from the end date, and check whether you arrive at LS = 0.
- Critical path: mark all activities with zero float and add up their durations as a check.
- Float: note the total and free float for each non-critical activity and indicate where the two differ.
- Gain: find at least one Finish-Start relationship that you can convert into Start-Start and calculate how many days that saves you.
Summary
- You derive your activity list from the work packages in your WBS. Duration is elapsed time in working days, not the number of hours of effort.
- The trickiest step is determining the immediate predecessors: what has to be finished before this activity can start.
- Finish-Start is the default. With Start-Start you let work overlap, with Finish-Finish you let two activities end together. A lag is waiting time, a lead lets the successor start earlier.
- Each node has six fields: ES, duration, EF on the top line and LS, float, LF on the bottom line.
- Forwards: the ES of the first activity is 0 and EF = ES + duration. Where several arrows come in, you take the highest EF.
- Backwards: the LF of the last activity is its own EF and LS = LF - duration. Where there are several outgoing arrows, you take the lowest LS. Your start activity should come out at LS = 0.
- The critical path is the longest chain through the network. You recognise those activities by their float of zero: ES and LS coincide.
- Total float is LS minus ES: the room you have before the end date shifts. Free float is the lowest ES of the successors minus the activity's own EF: the room you have before your successor has to move.
- Float belongs to the path, not to the first activity that uses it up.
- PERT: te = (O + 4M + P) / 6 and sd = (P - O) / 6. Add up the variances on the critical path and take the square root to say something about your end date.
Three arrows come into an activity, from predecessors with an EF of 6, 9 and 7. What is the ES of this activity?
Activity C has a total float of 1 day and a free float of 0. What does that mean?
For an activity you estimate 5 days optimistic, 8 days most likely and 17 days pessimistic. What is the expected duration according to PERT?
Ready for the next step?
You have completed the free starter of IPMA-D. The next chapter in the full course is Project-based working: The characteristics of a project, the continuum of types of work, the line from project to portfolio and the role of the project manager.
Take the 4-day course →From €2700,- excl. VAT · with an experienced trainer included