


Introduction
A report that nobody uses is expensive paper. Yet it happens again every month: figures neatly delivered, on time, accurate to the last decimal, and on the other side of the table someone who doesn't know what decision to take with them. That is the real problem with reporting. Not in the data, but in translating data into something someone can act on.
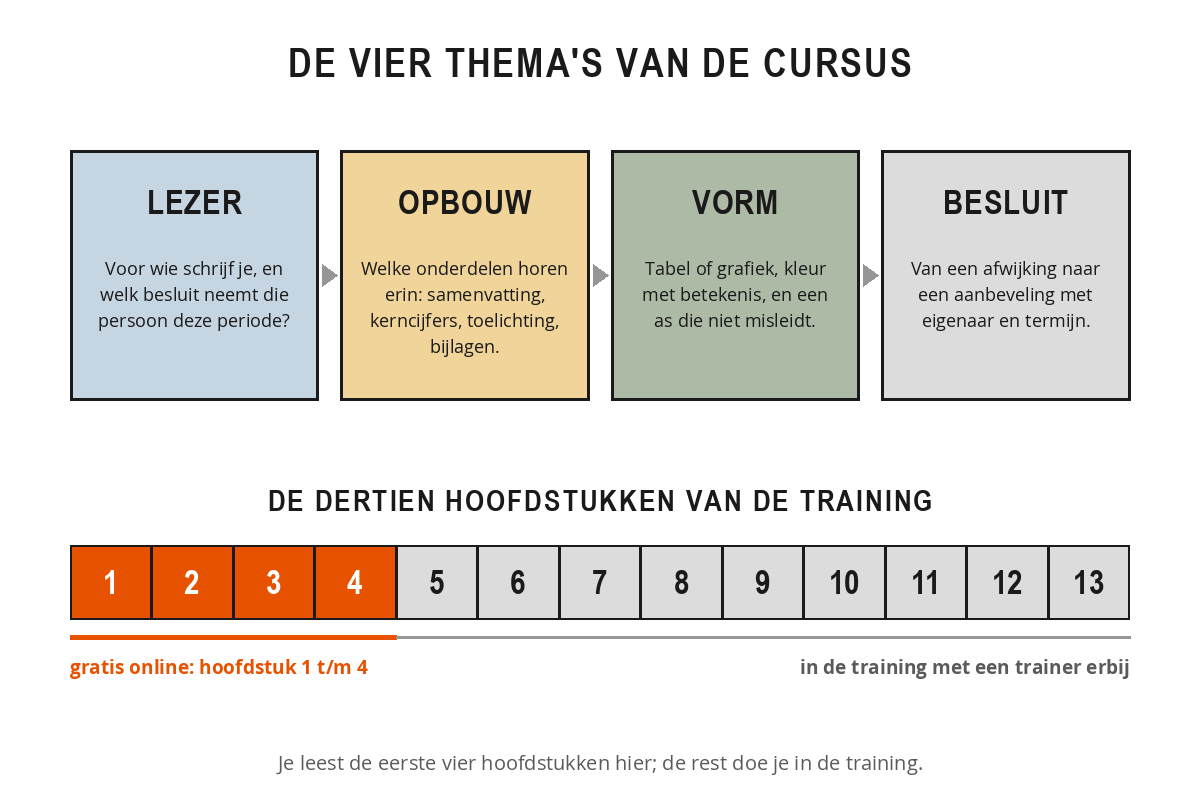
This free course contains the first four chapters: the orange part of the bar above. At the bottom of chapter 4 you will find the full course.
The three questions a report answers
A general ledger print-out also contains data, but it leaves the reader to work out what matters. The moment you take on that job, you create management information. You do that with three questions. What has happened? That is the review: the results and the events behind them. Where do we stand now? That is the comparison with the target, including the variances and their cause. And where are we heading? That is the outlook, with a forecast and a choice to be made.
Reports that achieve little get stuck at the first two questions. They are correct, they are complete, and they are non-committal. Take this sentence: "Staff costs in the second quarter came to 1.42 million euros." What is that being compared with? And what is the reader supposed to do now? With all three questions answered it becomes: "Staff costs came to 1.42 million, 8 per cent above budget, entirely due to contract staff in the Service department. If nothing changes, we will exceed the annual budget by 340,000 euros; recruiting two permanent staff will halve that from the fourth quarter onwards." The same figures, and now there is a decision on the table.
What you will learn
You start with your reader, because without a recipient facing a decision, every choice after that is arbitrary. Next you build the front end of your report: the management summary and the key figures block, the two pages where the work is done. The third chapter is about form: when a table works better than a chart, how to use colour to carry meaning rather than decoration, and how an axis can mislead your reader. The fourth chapter closes the circle: you unpick a variance until you know exactly who can do something about it, and you write a recommendation that someone can say yes or no to.
How the course is structured
The course follows four themes that build on one another. You start with the reader: who are you writing for, and what decision does that person take? Then comes the build-up: which components belong in your report and in what order. After that the form: how to present figures so that the eye finds the variance straight away. And you finish with the decision: from a variance to a recommendation with an owner and a deadline. Every chapter contains theory, a diagram, worked examples and an exercise that you apply to your own report.
Practical tips for use
- Keep one existing report to hand, preferably the last one you produced or received. You can put it alongside each chapter.
- Note down the pitfalls you recognise as you go. That list will be the basis of your own improvement plan.
- Don't read it all in one go. One chapter a week, with a reporting cycle in between to try it out, will get you more.
- Test your assumptions with your readers. The question "if I leave out this appendix next month, will you miss it?" takes a minute and sometimes saves you ten pages.
- Don't change everything at once. Start with the summary; that is the page everyone reads.
Each chapter ends with a short knowledge check of three questions: answer them correctly to mark the chapter as completed. Your progress is saved automatically in your browser.
Enjoy reading, and above all: enjoy the first meeting in which a decision is actually taken.