


4. From figure to decision
An overrun of 84.000 euros on staff costs is not a message. The message lies in the question of where those 84.000 come from, which part can still be influenced and who can do something about it this month. In this chapter you take the final step: from a variance in a table to a sentence that someone says yes or no to.
After this chapter:
- You break a total deviation down into the separate causes that contribute to it.
- You recognise the difference between a price effect, a volume effect and a timing effect.
- You build a narrative from the figures with one main theme per period.
- Write a recommendation with an action, an owner, an amount and a date.
- You present an expectation with a range instead of a single falsely precise figure.
Breaking down a deviation
Variance analysis is the unravelling of one total deviation into the separate effects that together explain that difference. You start from the standard, add or subtract the individual causes, and arrive at the actual figure. Every intermediate step is a separate conversation, with a separate owner.
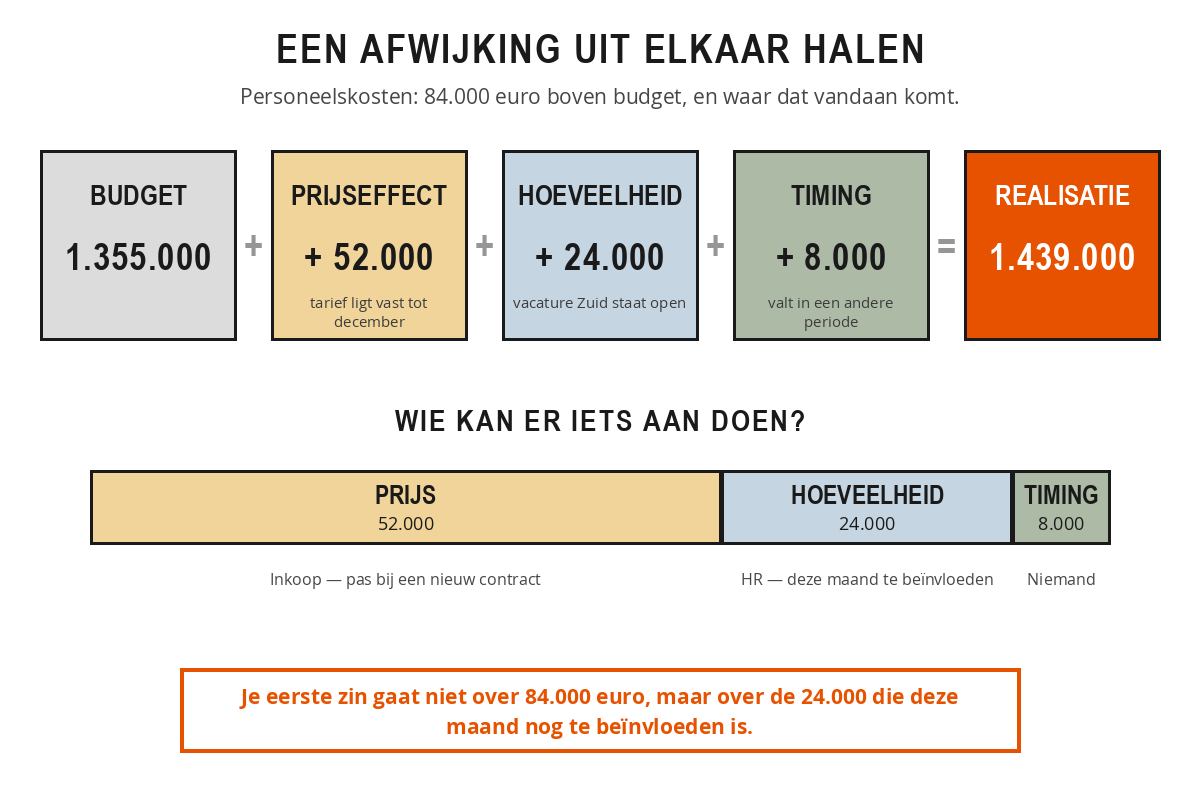
A waterfall chart like this forces you into something a table does not: every euro has to land somewhere. If a residual item remains that you cannot name, your analysis is not finished. Put the items in order of size, with the largest variance directly after the norm. The reader then sees at a glance which effect is worth discussing and which two you are only showing for completeness.
Price, volume or timing
With almost every cost item or revenue line you can break the variance down along three lines. With a price effect the price per unit deviates while the volume is correct: a contractor rate that is twelve euros per hour higher than budgeted. With a volume effect the price is correct but the volume differs: you have taken on nine hundred contractor hours instead of the six hundred budgeted. And with a timing effect the amount is correct over the year, but falls in a different period than budgeted: a maintenance job that shifts from June to September produces two deviations that cancel each other out.
That distinction is not academic. A price effect leads to a conversation with procurement. A volume effect leads to a conversation about planning or staffing. A timing effect leads to nothing more than a line in the commentary. Anyone who lumps the three together lets the management team spend half an hour discussing a problem that does not exist.
The staff costs from chapter 2 came out at 1,439,000 euros against 1,355,000 budgeted: 84,000 euros over, 6.2 per cent. Broken down, it looks rather different.
The price effect is 52,000 euros: the hourly rate of the two contracted engineers is 40 per cent above the internal rate, and that rate is fixed in the framework contract up to and including December. The volume effect is 24,000 euros: more contractor hours were used than budgeted, because the vacancy in the South has been open since April. The timing effect is 8,000 euros: January's training days were already invoiced in December.
The first sentence of your explanation is now not about 84,000 euros, but about 24,000 euros of contractor hours. The price element is fixed until December and the timing element will unwind by itself. Only that middle amount can still be influenced this month, and that is exactly what the discussion should be about.
If your residual item is larger than a quarter of the total, note down which source data you are missing in order to break it down after all, along with a date. That is a better answer than a fourth block with the word "other" on it.
The story behind the figures
A broken-down variance is not yet a decision. In your commentary you tie the separate differences together into a single storyline about the period: this is what happened, as a result this went differently, and that is why the year stands where it does. It is not a list of items but a line of reasoning, and three lines keep it usable.
One main point per period. You choose the deviation that has the greatest impact on the annual result and make that the lead item. The other differences sit beneath it or go into the explanatory notes at the back. Two main themes side by side produce a meeting in which the management team takes half a decision on each.
Chronology over administration. You tell the story in the order in which things happened, not in the order of your chart of accounts. A reader follows an event more easily than a category: the vacancy arose in April, the contractor started in May, the rate turned out to be higher, and in September you see that reflected in the margin.
Fact and interpretation kept separate. What has been measured goes in one sentence. What you infer from it goes in the next. That way the management team can dispute your conclusion without distrusting your figures, and that saves you a discussion about the reliability of the bookkeeping when it should be about the decision.
The recommendation with an owner
The recommendation is where the action orientation from chapter 1 is made concrete. A workable recommendation names four things: the action, the person who will carry it out, the expected effect in euros and the date on which that effect will be visible. If one of the four is missing, it remains a suggestion that disappears into the minutes.
Weak: "Attention to the contracting costs is desirable."
Strong: "Esther (HR) will convert the open vacancy in the South into a six-month secondment contract before 1 November. This lowers the hourly rate by around 18 per cent and, at an unchanged volume, saves approximately 9,000 euros per quarter. The management team is asked to approve the longer contract term. The effect will be visible in the December report."
Doing nothing is also an option, and you cost that up as well: continuing until the end of the contract will cost roughly another 34,000 euros at the current volume. A choice between two stated outcomes leads to a decision more quickly than a single proposal that can only be rejected.
Looking ahead with a range
A forecast is the current expectation for the year end: the actuals to date plus the expected remaining months. Unlike the budget, it is not fixed. You revise it as soon as you know more, and it is precisely that revision that makes it suitable for steering by. A budget tells you what you thought last October; a forecast tells you what you think now.
Give that expectation a lower and an upper limit. That range is not a hedge but information: it shows how much room there still is to make adjustments and which assumptions make the difference between the two ends. So for every forecast, note down the two or three assumptions that most strongly determine the outcome, along with their owner. The further ahead you look, the wider the range, and that is more honest than a single figure to two decimal places.
The forecast for staff costs comes out at 1,925,000 euros, against an annual budget of 1,820,000. The range runs from 1,880,000 to 1,970,000 euros. Two assumptions determine that difference: whether the vacancy in the South is filled by 1 December (owner Esther, HR) and whether the project in the North continues into January (owner Rachid, operations).
At the bottom of the range the overrun stays below 60.000 euros and no intervention is needed. At the top it rises to 150.000 and the decision on the secondment is unavoidable. That makes the conversation concrete: it is no longer about the figure, but about the two assumptions behind it.
Pick one item from your most recent report where the deviation was larger than your threshold for providing an explanation.
- Note the total deviation in euros and percentages, and split it across price, volume and timing.
- Put a name against each effect: who can do something about it?
- Write down the residual item you cannot explain, and what you need in order to break it down after all.
- Formulate one recommendation with the action, owner, amount and date, and note underneath what doing nothing would cost.
Discuss your assumptions with the owner before you circulate the report. A recommendation that the owner hears for the first time in the meeting is rarely adopted.
Summary
- Variance analysis breaks a single deviation down into the effects that explain it; every euro has to land somewhere.
- Price, volume and timing lead to three different conversations with three different people.
- A timing effect deserves a line in the explanatory notes, not an agenda item.
- The story behind the figures has one main theme per period, follows the chronology and separates fact from interpretation.
- A recommendation names the action, the owner, the amount and the date. If one of these is missing, it is a suggestion.
- Include the "do nothing" option, with the amount that this costs.
- A forecast is given a range, with the two or three assumptions and their owner alongside.
An 8.000 euro maintenance job that shifts from June to September produces which effect?
Which four elements belong in a recommendation according to this chapter?
Why do you present a forecast with a range rather than as a single figure?
Ready for the next step?
You have completed the free starter of Effective reporting. The next chapter in the full course is The management report as a steering instrument: The three reporting questions, the reporting cycle as a rhythm and the types of management report.
Take the 1-day training course →From €625,- excl. VAT · with an experienced trainer alongside you