


3. From variance to action
You know which figures you are tracking and you have established that something really is going on. Then the work that figures are meant for begins: doing something with them. In practice things often run aground at this point. Measuring is done neatly, the meeting establishes that the figure is disappointing, someone says it was busy, and the next month the same figure is there again. This chapter is about the two steps that are then missing: honestly working out where it comes from, and choosing the smallest intervention that solves it.
After this chapter:
- You know the four steps of the performance cycle and where your department gets stuck.
- You distinguish between the signal, the direct cause and the root cause.
- You can keep asking why five times until you reach something you can genuinely tackle.
- You know the four types of intervention and which one fits which cause.
- You know why you choose the smallest intervention and how to measure whether it works.
The performance cycle in four steps
Managing by the numbers is a loop you run again and again: set a goal, measure, analyse, intervene, and then start over with what you have learned.
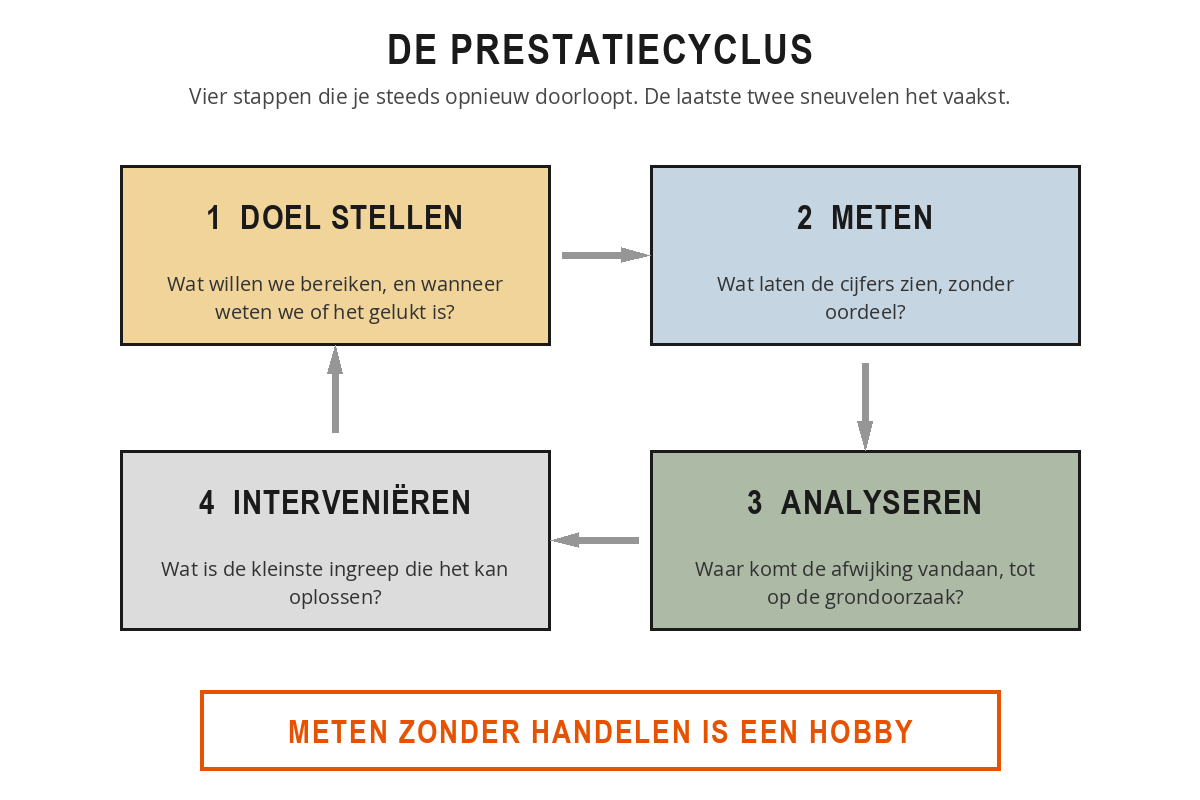
Setting objectives. What do you want to achieve, when, and how will you know you are there? The objective is the destination ("in the third quarter we want to bring the lead time back down to five working days"), the KPI is the gauge you read along the way to see whether you are on course. A good objective is concrete enough to recognise six months later as met or not met, ambitious enough to ask something of your team, and linked to an organisational objective so that everyone knows why.
Measure. This is where you take the figure from the source and put it on the table. The pitfall is not that you measure too little, but too much: every figure that comes in demands attention and a judgement. If you measure twenty things, no single figure gets real attention.
Analyse. This is where the thinking happens. You ask the golden question from chapter 2 and look for the pattern behind the deviation. This is the step that is skipped most often, because it takes time and because the first explanation that comes to mind always sounds convincing.
Intervene. This is where you change something: a conversation, an adjustment to the process, a course, a different priority. Without this step the cycle ends in a drawer full of reports.
Most managers recognise the cycle straight away and think: we already do that. Look more closely and steps 1 and 2 exist while 3 and 4 fall victim to the pressures of the day. The analysis is skipped because the answer seems "obvious enough", and the intervention gets no further than a remark in the team meeting. Without those last two steps, measuring is an expensive hobby.
Signal, direct cause, root cause
A figure is never the cause. A longer lead time is an outcome; somewhere in the work there is something that makes it take longer. To get there, you separate three layers.
- The signal: the figure that deviates from the norm or the trend. The average lead time this month is 8 days against a norm of 5.
- The direct cause: what went differently in the work. Two large customer orders sat waiting for approval for a week.
- The root cause: what it is in the way of working that allowed this to happen. No stand-in has been arranged for the approver when they are on holiday.
Intervening at the first layer is treating the symptom: you push the figure up. Intervening at the third layer solves the problem, including for the next holiday period.
Five whys
The simplest way to reach that third layer is to keep asking. With every answer you ask why again, until you arrive at something you can change yourself. Five is not a rule but a guideline: sometimes you are there after three steps, sometimes after seven.
The number of complaints rose from 4 to 11 this month. Why? Customers received their orders late. Why? The dispatch department had a backlog. Why? They were short-staffed for two days. Why? Two people called in sick at the same time and no stand-in was available. Why? The agreement with the recruitment agency quietly expired three months ago and nobody renewed it. The root cause is not illness, because that simply happens. The root cause is that the fallback is gone. That is also where the solution lies, and it costs one phone call.
The temptation to stop earlier is strong. Customer satisfaction drops, someone suggests it is down to the new colleague, that sounds plausible, and an induction plan is drawn up. Two months later the score has fallen further and the real cause turns out to lie in a changed ordering process. By then time and money have gone into a solution for the wrong question.
If one line of why-questions runs into a dead end because several things are going on at once, list the possible causes by category: people, method, system, customer and environment. Not every category yields something, and that is precisely what makes it useful: it forces you to look beyond the first explanation.
A cause you have found is not yet proof. Test it against the figures before you change anything. If you suspect the peak in complaints is down to staffing levels, then the absence days and the complaints should coincide in the same weeks. If you do not see that link, you are wrong and need to keep looking. While doing so, deliberately look for figures that could prove you wrong, not just for figures that confirm your suspicion.
Four types of intervention
Knowing the cause is not the end of it. Now you have to decide what you are going to do. An intervention costs time, money and your team's attention, so choose deliberately. Broadly speaking, there are four types.
- Process: you change something in the way the work runs. Adding a step, removing one, automating it or assigning it elsewhere. Suitable when the root cause lies in the process.
- People: you change something about what people know or do. Training, coaching, a different division of tasks, temporarily more hands. Fits when the issue is skill or staffing.
- System: you change something about the tools. An adjustment to the system, a different report, different equipment. Fits when the work gets stuck on the technology.
- Steering: you change something about priorities, norms or agreements. Adjusting a norm, moving a deadline, having a conversation about what takes precedence. Suitable when the issue is a lack of clarity about the objective.
You often need a combination. Arranging a stand-in (process) does not help if nobody knows when they may be called in (control).
Choose the smallest intervention that works
Adjusting literally means a small correction to your course, not turning the whole ship around. A reorganisation based on three months of figures is rarely sensible. With every intervention, ask yourself: what is the least that is needed to see in four weeks' time whether it works? If the answer is "one conversation with the approver", start there. If it is "a trial with one team", do that first. Major interventions are expensive and hard to reverse.
Sanne sees her team's lead time rise from 5 to 8 days. The first proposal on the table is a process-based working course for the whole team: 12 people, 4,000 euros, two days closed. She asks a few more questions first. In 80 per cent of cases the delay turns out to arise at one approval step that one colleague is responsible for. Her intervention becomes: a second colleague may now also approve up to 1,000 euros. Cost 0 euros, introduced on Tuesday. Four weeks later the lead time stands at 5.5 days. The course can still go ahead, but now she knows it is not needed.
After the intervention the cycle starts again. You measure whether the figure is moving as you expected, you look at what is going on now and you adjust again if necessary. Agree that measuring moment straight away, otherwise it disappears. That way steering on figures does not become an annual exercise but a rhythm that keeps your department sharp.
Take one figure from your department that deviated from the norm over the past period and work through the four steps on paper:
- Signal: which figure deviated, by how much and since when?
- Analysis: ask why at least four times, until you reach a cause you can influence yourself.
- Intervention: which type fits (process, people, system or steering) and what is the smallest action that can solve the problem?
- Measuring: which figure do you look at on which date to see whether it is working?
Put your answer to a colleague and ask one question: do you believe this is the real cause, or am I stopping too soon?
Summary
- The performance cycle has four steps: setting a goal, measuring, analysing and intervening. The last two are the ones most often dropped.
- Separate the signal (the figure), the direct cause (what went differently) and the root cause (what made that possible).
- Keep asking why five times until you reach something you can change yourself.
- Test your hunch against the figures before you step in, and also look for figures that prove you wrong.
- Interventions come in four kinds: process, people, system and steering. Often you need a combination.
- Choose the smallest intervention that can solve the problem and agree straight away when you will measure whether it works.
The lead time is 8 days against a norm of 5, because two orders were left waiting with an approver who was on holiday. What is the root cause here?
Sanne can choose between a 4.000 euro course for her whole team or giving a second colleague approval rights up to 1.000 euro. What does this chapter say?
A team measures diligently, discusses the figures every month, but year after year sees the same deviations recurring. Where does the performance cycle get stuck?
Ready for the next step?
You have completed the free starter of Managing by the Numbers. The next chapter in the full course is Figures as the language of the organisation: Why figures give your story weight, and how you steer upwards, sideways and downwards.
Take the 2-day course →From €1250,- excl. VAT · with an experienced trainer included