


2. Reading a variance
You have chosen your figures, the report comes in, and something is showing red. What now? The temptation to react straight away is strong: an email to the team, an item on the agenda, a remark in the meeting. But a figure that deviates is not yet a problem. It can be a signal, and it can be coincidence. This chapter is about that distinction, and about the four questions you ask of every figure before you do anything.
After this chapter:
- Do you know why a number without a comparison says nothing.
- Whether you can ask the golden question in four layers about every figure in your report.
- You recognise the difference between measurement noise and a real signal.
- Do you see what an average hides from you, and when to bring in the median.
- Can you tell a spike from a trend before you intervene.
A figure without a comparison says nothing
"Turnover was 96.000 euro." Is that good news? You have no idea, and that is exactly the point. Only with the target alongside it, or with last month, or with the same month last year, does it become a message. That is why every figure you follow seriously needs four things: the name of the KPI, the current value, the target or the previous period, and the direction in which it is moving. That last one is the line of the past eight to twelve measurements, even if only as a small graph. Without that line you see a snapshot, and snapshots are misleading.
The golden question in four layers
With every figure you ask the same question: what does this tell me? That question has four layers, and most reports get no further than the first two.
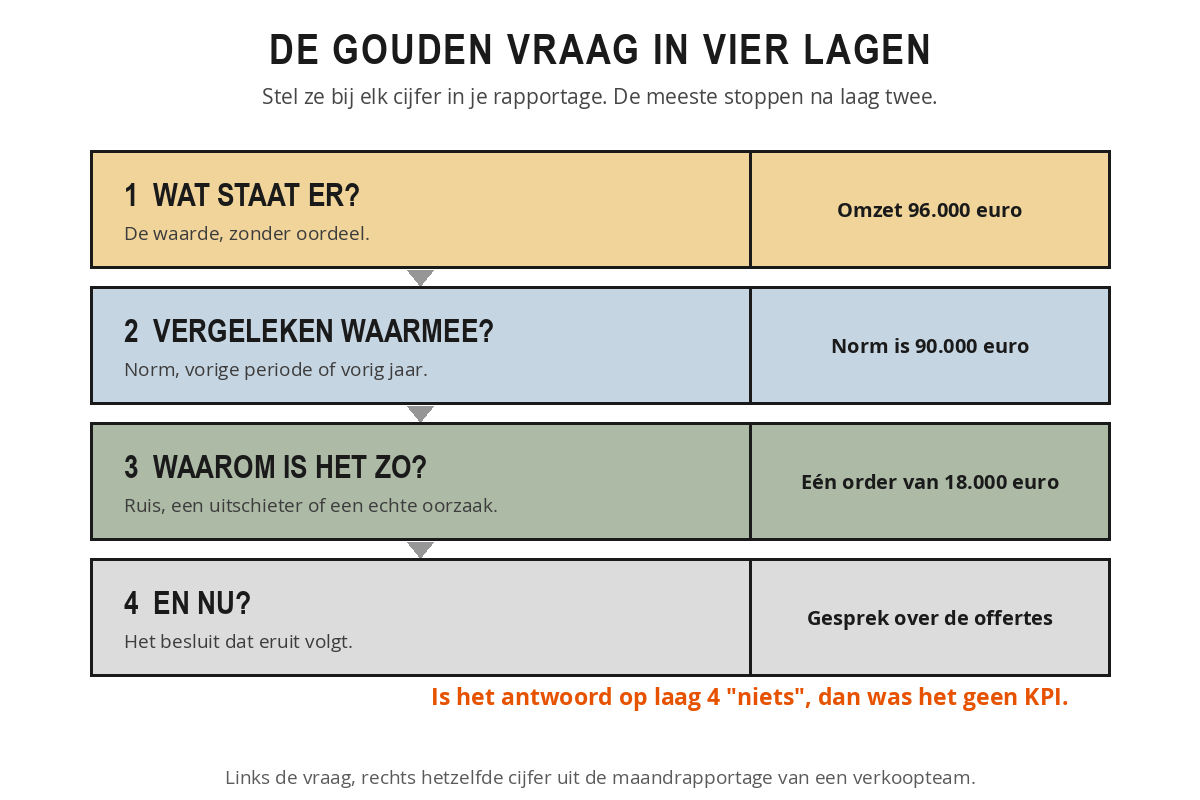
What does it say? The actual value. Revenue is 96,000 euros, absence is 5 per cent, the lead time is 8 days. Purely reading it off, without judgement.
Compared with what? Against the target, the previous period, the same period last year or a comparable team. Choose that comparison in advance and stick to it, even if you do not like the outcome. Anyone who picks a different comparison each month delivers stories instead of control.
Why is it like this? The cause. Is turnover above target because of one large order or because of structurally more customers? That is a completely different story, and it determines whether you need to do anything.
What now? The consequence. What does this mean for your actions next week? If the answer is "nothing", then it was not a KPI but background information.
Ruben sees 96.000 euros in turnover in his monthly report against a norm of 90.000 euros. Green, so on to the next point. Even so, he works through the four layers. What does it say: 96.000 euros. Compared with what: 6.000 euros above the norm, and above the 84.000 euros in March. Why is it so: it includes a single order of 18.000 euros from a customer who orders once every two years. Without that order it is 78.000 euros, the lowest month of the year. And now: he puts the discussion about quotation numbers on the agenda after all, and tells his manager that the green month rests on one order. Without layer three he would have let that quarter run on quietly.
Noise or signal
Every measurement wobbles. Even if nothing changes in the work, two consecutive measurements almost never produce exactly the same figure. That is called measurement noise, and it is not a problem as long as you know how large that noise is. A figure that fluctuates from week to week between 4,2 and 4,8 with an average of 4,5 is stable. An outlier to 4,7 is then not news. An outlier to 6,1 is.
The rule of thumb: if a change falls within the usual range of the measurement, it is not yet a signal. Only when a figure demonstrably falls outside that, or when three or four measurements in a row move in the same direction, does it become interesting. So with a new figure, always ask: how much does this normally fluctuate? If nobody knows, that in itself is information.
A second pitfall is attached to this: false precision. A figure looks more accurate than it is, usually because of the decimal places. If it says that the average handling time is 4,37 minutes against 4,29 last month, that gives the impression that those 0,08 mean something. If that same measurement is recorded manually by three people who think differently about the moment a conversation is "handled", then five seconds of difference falls well within their own room for interpretation. There is no change, only noise. So round to what you can justify. For most management figures, whole numbers or one decimal place are enough.
False precision is not just cosmetic, it changes the conversation. If you say "conversion has fallen by 0,3 percentage points", it sounds like a fact someone has to respond to, and you automatically start looking for someone to blame. If you say "this is moving within the normal bandwidth, we see no real change", the conversation stays open.
What an average conceals
The average is the most widely used figure in any report, and the most convenient: a single number summarises an entire series. It is also the most dangerous, because that same number conceals precisely what you as a manager ought to see.
Two teams handle customer queries. Team A takes an average of 4 days, and so does team B. On the report they therefore appear equal. Look at the underlying figures and team A always delivers within 3 to 5 days. Team B varies between 1 and 12 days: some customers have an answer the next morning, others wait two weeks. The average is identical, the customer experience completely different. With team B, speed is not the problem, unpredictability is. That is a different conversation and a different intervention.
That difference is called spread: the extent to which the individual measurements lie around the average. Ask about it as a matter of course. What is the highest and the lowest measurement behind this average?
Alongside the average there is the median: the middle value when you line up all measurements from smallest to largest. If the two are close together, the distribution is even. If they diverge, an outlier dominates the picture. Ten customers together generate 100.000 euro: nine small customers of 5.000 euro and one large one of 55.000 euro. The average is 10.000 euro per customer. The median is 5.000 euro. Anyone steering on the average thinks they have a healthy customer base. Anyone who also looks at the median sees that half of the revenue hangs on a single customer.
Another pitfall is the average of averages. If you have three teams with satisfaction scores of 7, 8 and 9, the average is not automatically 8. That only holds if the teams have served an equal number of customers. If the team with the 7 has served ten times as many customers, the real average lies just above 7. So never combine averages without weighting them by number, otherwise you are calculating a fiction.
Spike or trend
The last mistake is the best known: treating one striking measurement as the start of a development. Customer satisfaction has been at 7,8 for three quarters and this month it is 8,4. Champagne? Not yet. One measurement is a point, not a line. Perhaps the sample happened to include a favourable group of customers.
The opposite mistake is riskier, because it costs you months. The lead time rises steadily over six months: 4,2 then 4,5 then 4,8 then 5,1 then 5,4 then 5,7 days. Each month the increase is small and each month an explanation is ready to hand: a colleague off sick, a busy week, a difficult customer. Anyone who dismisses every deviation as an incident fails to see that something structural is shifting. Three tools help you spot the difference.
- Moving average: look at the average of the last three or six measurements instead of at the individual month. A one-off peak dilutes by itself, a trend remains.
- A band around the target: draw the normal fluctuation around your target as a band on the graph. Measurements within the band are noise. Several measurements outside it, on the same side, are a trend.
- Counting in the same direction: four or five measurements in a row heading in the same direction are statistically no longer a coincidence. That is the moment to act, not earlier.
For every key figure on your report, include a small trend line covering the last eight to twelve measurements. That way you can see at a glance whether the current figure falls within the normal bandwidth or whether something is really shifting. Without that line, every figure is a moment without a history.
Take the latest report for your department and pick out three figures. For each figure, answer the four layers: what does it say, compared with what, why is it like this, and what now? Then go through these three:
- How many decimal places are given, and can you justify them?
- Do you know how large the normal fluctuation in this measurement is?
- Is your conclusion based on one measurement or on a series?
If you cannot answer one of the four layers, note down why not: is the benchmark missing, is the trend invisible, or is the cause nowhere to be found? That list is your point for improvement in next month's report.
Summary
- A number without a norm, previous period or trend line says nothing.
- The golden question has four layers: what does it say, compared with what, why is it like that, and what now? The last two only appear if you insist on them.
- Every measurement contains noise. Within the usual bandwidth, a deviation is not yet a signal.
- Decimals that the measurement cannot support create false certainty and lead to discussions about a difference that is not there.
- With every average, ask about the spread and the median, and only combine averages if you weight them by number.
- One measurement is a point. Only four or five measurements in the same direction make a trend.
The report shows 96.000 euros in turnover against a norm of 90.000 euros. Which layer of the golden question shows that there may still be a problem?
Two teams handle customer queries in an average of 4 days. Team A always delivers within 3 to 5 days, team B within 1 to 12 days. What follows from that?
Customer satisfaction has been at 7,8 for three quarters and is 8,4 this month. What do you do according to this chapter?