


1. Reading the balance sheet
The balance sheet is a photograph, not a film. On a single day, usually 31 December, it records what the organisation owns and whose money paid for it. That is all it is. Even so, many people are put off by it, because at first glance it is a wall of numbers. Once you know how that wall is arranged, you can read it.
After this chapter:
- You know how a balance sheet is structured and why the left and right sides are always equal.
- You recognise the main items on both sides.
- You know the difference between fixed and current assets, and between equity and debt.
- You understand why an amount on the balance sheet is the result of a choice rather than a measurement.
- You know which three comparisons you make before forming a judgement.
On the left what you have, on the right whose it is
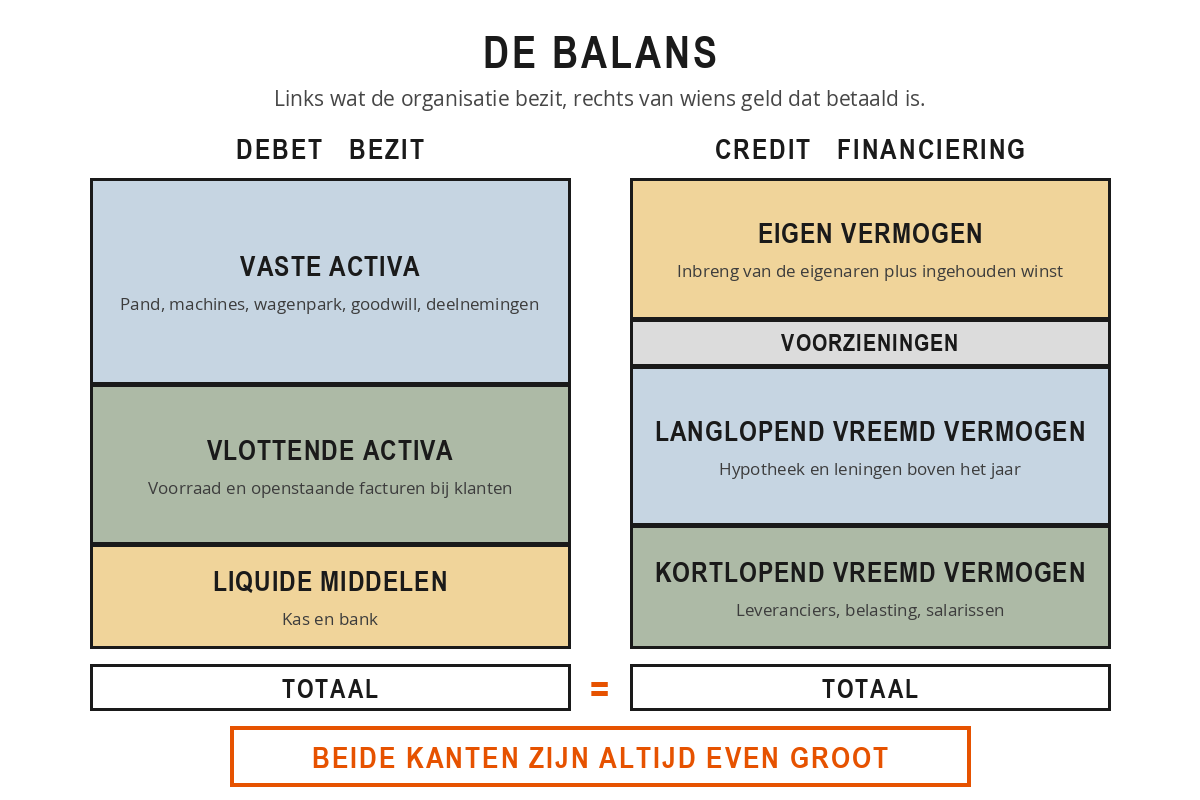
Picture a sheet of paper with two columns. The left-hand column shows what the organisation owns: the building, the vans, the stock, the money in the bank. That side is called the debit side, or the assets. The right-hand column shows where that money comes from: from the owners, from the bank, from suppliers who have not yet been paid. That side is called the credit side, or the liabilities. At the bottom of both columns stands the same total.
That balance is not an accounting trick, it is logic. Every euro in the organisation has come from somewhere. If a company buys a van for 40.000 euro, that van appears on the left as an asset. On the right is its counterpart: the money came out of its own cash, or from the bank, or the supplier still has to be paid. Assets without a source of finance do not exist. That is why it is called a balance sheet.
The left-hand side: what does the organisation own?
On the left are the assets, in order of permanence. At the top what stays for a long time, at the bottom what quickly turns into cash.
Fixed assets last longer than a year and are needed in order to work. There are three kinds. Tangible fixed assets are physical: a building, machinery, a fleet of vehicles, fixtures and fittings. Intangible fixed assets are not: goodwill, a patent, a multi-year software licence. Financial fixed assets are long-term investments, a participating interest in another company or a loan you have granted yourself.
Current assets become cash within a year or disappear within a year. The stock in the warehouse is sold. The amount owed by a customer, a debtor, is paid in thirty or sixty days. At the bottom are the liquid assets: cash and bank, money in its purest form. Fixed assets stand still, current assets flow.
Plenty of money in the bank sounds good, but too much is not ideal either. That money is doing nothing, while it could have earned a return or paid off a debt.
The right-hand side: who paid for it?
On the right is where the money came from, ordered by how long it stays. At the top what is in there permanently, at the bottom what has to be repaid quickly.
Equity is the owners' money: what they have put in plus all the profit that has not been paid out over the years. It never has to be repaid. It is the organisation's buffer and largely determines how much of a setback you can absorb.
Provisions often sit in between: money set aside for something that is certain to come but whose amount or timing is still unknown, such as major maintenance on the roof or an ongoing dispute.
Debt is borrowed money, in two varieties. Long-term is anything with a term of more than a year: a mortgage on the premises, a bank loan. Short-term has to be repaid within a year: trade creditors, tax still to be paid, the current account facility, salaries that still need to reach your people's accounts.
On 31 December, installation company Van Dijk has on the left a business premises worth 240,000 euros, two vans worth 60,000 euros together, stock of 45,000 euros, outstanding customer invoices of 80,000 euros and 25,000 euros in the bank. The left-hand side adds up to 450,000 euros.
On the right there is 150,000 euros of equity, a mortgage of 180,000 euros, 90,000 euros of unpaid suppliers and 30,000 euros of tax still to be paid. Also on the right: 450,000 euros. Of every euro in this business, 33 cents belongs to the owner and 67 cents to someone else.
An amount on the balance sheet is a choice
This is where perceptions often go wrong. A balance sheet measures nothing. Two companies doing exactly the same thing can show a different balance sheet because they apply different rules.
In the Netherlands, historical cost is the most common approach: you value an asset at what you paid for it, minus depreciation. A building bought in 2005 for 800,000 euros appears on the balance sheet at that amount, even if it is now worth twice as much. That feels odd, but there is logic behind it: underneath historical cost lies an invoice, and underneath current value lies an estimate.
Depreciation is spreading a purchase over the years you use it. You do not depreciate land, it does not wear out. A building you do, often over thirty to forty years. A laptop over three years. And the faster you depreciate, the lower your profit now and the lower the carrying amount on the balance sheet, but also the less it affects you later. That is a choice, not a law of nature.
Van Dijk buys a van for 40,000 euros. The van lasts five years and is worth 5,000 euros after that. So the company depreciates 7,000 euros a year: 40,000 minus 5,000, divided by five. After three years the van is on the balance sheet at 19,000 euros. What it would fetch at the dealer is another matter entirely, and that is not what the balance sheet is about.
Three comparisons before you pass judgement
The numbers on their own say little. The ratios tell the story, and you only see those by comparing. Do that in three ways.
Compare the parts with the whole. What share of the total is equity? How is the left-hand side split between fixed and current assets? A manufacturing business logically has a lot of machinery, a wholesaler a lot of stock, a consultancy almost no fixed assets but plenty of trade debtors. The shape of the balance sheet matches the business model.
Compare with last year. One balance sheet tells you less than two balance sheets side by side. Shifts are the most interesting: they raise a question.
Compare with the sector. Equity of 25 per cent sounds thin, but for a supermarket chain that is perfectly normal. For a family-owned manufacturer it is tight. Banks, trade associations and the CBS publish figures you can set alongside your own balance sheet.
Sanne is a team leader at a wholesaler and puts two balance sheets side by side. Turnover has stayed the same, but stock went from 45,000 to 70,000 euros and the bank balance dropped from 25,000 to 8,000 euros. So 25,000 euros in cash has ended up sitting in the warehouse without being sold. Sanne does not need to be an accountant to ask the right question: which part of that stock has been there for more than a year, and what is it still worth?
With every balance sheet you receive, ask about the valuation principles. They are set out in the notes to the financial statements. Once you know how items have been valued and depreciated, you also understand why the figures are as they are, and how much weight you may attach to them.
Take the balance sheet of your own organisation, or that of a company you know. Many companies publish their annual accounts on their site under investor relations, and for any Dutch company you can request a filed version from the Chamber of Commerce. Then answer five questions:
- What share of total capital is equity?
- How do the fixed assets relate to the current assets?
- Which item is the largest on the left, and does that fit what the organisation does?
- What shift do you see compared with last year?
- What question would you put to the controller about this?
That last question is the most important one. If you have one within twenty minutes, you have read the balance sheet.
Summary
- The balance sheet is a snapshot: on the left what the organisation owns, on the right how that was paid for.
- Both sides are always equal, because every euro of assets has an origin.
- On the left are the fixed assets (tangible, intangible, financial) and the current assets (stock, debtors, cash), in order of how quickly they turn into money.
- On the right are equity, provisions, long-term liabilities and short-term liabilities, in order of how long they stay put.
- The amounts are the result of valuation choices: historical cost, depreciation period, stock valuation, the size of a provision.
- Only judge after three comparisons: the part against the whole, this year against last year, and your organisation against the industry.
Why are the two sides of a balance sheet always equal?
A van costing 40,000 euros lasts five years and is worth 5,000 euros after that. At what amount does it appear on the balance sheet after three years?
At a wholesaler, stock rises over the course of a year from 45,000 to 70,000 euros while turnover stays the same. What is the best first signal to take from this?