


2. Reading the profit and loss account
Where the balance sheet is a photograph, the income statement is a film. It shows what came in over a full year, which costs were set against it and what was left at the bottom line. You will also come across it as the profit and loss account, or the P&L for short. In a monthly report you usually see a condensed version of exactly this overview.
After this chapter:
- You recognise the build-up from turnover to net profit and know why it runs in steps.
- Know the difference between gross profit, operating profit and net profit.
- You can name and place the four main cost groups.
- You know what fixed, variable, direct and indirect costs are and why that distinction matters.
- You see where the income statement and the balance sheet are attached to each other.
The steps from turnover to net profit
The logic is simple: revenue minus costs is profit. The art is in the order. The costs are deducted step by step, and after each step there is an intermediate result that tells you something different.
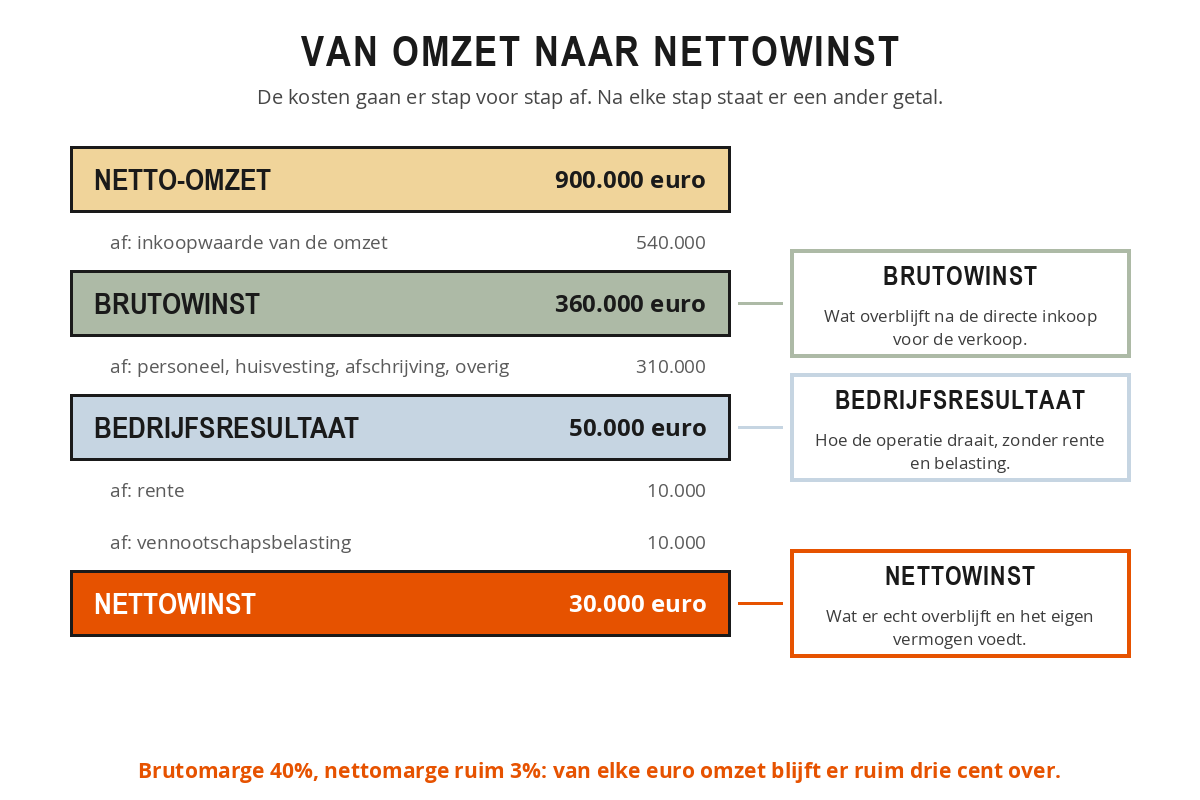
At the top is the net turnover: everything you have invoiced to customers during the year, excluding VAT and after deducting discounts and returns. Note that word invoiced, because that is something different from received. An invoice that goes out in December counts towards that year, even if the customer does not pay until February.
Below that is the cost of sales: everything you had to buy or hire in directly for what you sold. In a trading company that is the purchase price of the goods resold; in a service provider it is the hours of the people who did the work. Deduct that and you are left with the gross profit left.
Below that come the operating costs: everything you spend to keep the place running. What is left after that is the operating profit, in English EBIT. That figure shows how well the operation itself is running, regardless of how the company is financed and regardless of tax. If you want to compare two companies, one of which has borrowed heavily and the other not, then the operating profit is a fairer measure than the net profit.
There are two more items below the operating profit. First the interest that you pay on loans, minus the interest you receive yourself. That brings you to the result before tax. From that, the corporation tax off it, and then at the bottom you are left with the net profit.
Installation company Van Dijk invoiced 900,000 euros last year. The materials and the hired-in work for this cost 540,000 euros, so the gross profit is 360,000 euros: a gross margin of 40 per cent.
The operating costs are then deducted: 210.000 euro of staff, 30.000 euro of premises, 25.000 euro of depreciation and 45.000 euro of other costs, 310.000 euro in total. The operating result is therefore 50.000 euro. After 10.000 euro of interest, 40.000 euro is left, and after 10.000 euro of tax Van Dijk keeps 30.000 euro of net profit. Just over three cents of every euro of revenue is left.
The four main cost groups
Below gross profit you will almost always find the same four groups. Staff costs: salaries, social security contributions, pension contributions, training and temporary staff. For most organisations this is by far the largest item. Premises costs: rent, energy, cleaning, maintenance. Depreciation: the annual depreciation of machinery, fixtures and vehicles. And other operating expenses: marketing, IT, insurance, accountant, travel and everything else.
Depreciation is a special case, and it is where many people get stuck. It is a cost item where no money leaves the business. You paid for the machine three years ago, and you now spread that outlay across the years in which you use it. As a result, a company can show a decent profit and be short of cash at the same time, or the other way round.
Fixed or variable, direct or indirect
To understand a profit and loss account, it helps to classify costs in two ways. Those two classifications are independent of each other and answer a different question.
The first question is: does this cost item move with revenue? Variable costs do. If you sell twice as much, you also purchase roughly twice as much material. Fixed costs do not, at least not in the short term: the rent on your premises is the same whether you sell a hundred or a thousand units. This distinction determines how vulnerable an organisation is if turnover disappoints. High fixed costs mean a high threshold before you have covered your costs.
The second question is: can you allocate these costs to a single product, project or customer? Direct costs you can: the materials for a specific order, the engineer's hours on a job. Indirect costs you cannot: reception, the IT department, the board. They are necessary, but they do not belong to a single sale. To find out what a product or department actually yields, they are usually allocated using an allocation key, for example by revenue or by the number of hours worked. Always ask which key has been used, because it determines whether your department comes out looking good or bad.
A printing company has 180.000 euro of fixed costs per year: rent, machinery and permanent staff. The variable costs average 40 per cent of the selling price, so out of every euro of revenue 60 cents are left to cover those fixed costs. The printing company therefore has to generate 300.000 euro of revenue before it breaks even: 180.000 divided by 0,60. Every euro of revenue above that yields 60 cents of profit, every euro below it costs 60 cents.
Margins tell you more than amounts
A margin shows what is left of every euro of turnover, and there are three levels. The gross margin is the gross profit divided by turnover, and says something about your purchasing power and your pricing. The contribution margin deducts all variable costs from turnover and shows what contributes to covering your fixed costs. The net margin is the net profit divided by turnover, so after everything: after costs, after interest and after tax.
A margin only means something in comparison. A net margin of 3 per cent is dire for a software company and perfectly normal for a building contractor or a supermarket. So compare with last year and with your own sector, never with a percentage you happened to pick up somewhere.
A furniture shop has a turnover of 500,000 euros and bought that furniture in for 280,000 euros. The gross profit is 220,000 euros, or 44 per cent. Last year it was still 48 per cent. Four percentage points sounds like a detail, but on 500,000 euros of turnover it amounts to 20,000 euros less profit, and for this shop that is more than the entire annual profit. So the question is not whether it matters, but where the leak is: rising purchase prices, more discount given, or more sales of the products with the thinnest margins.
In a monthly report, look not only at the amounts but also at the percentages. Turnover that rises by 10 per cent while the gross margin drops by 2 percentage points looks good at the top of the report and worse than last year at the bottom. Percentages show sooner that something is shifting.
The bridge back to the balance sheet
The balance sheet and the income statement are not separate documents. The clearest link runs through the net profit: whatever is left at the bottom and is not paid out as dividend goes to the equity on the balance sheet. A profitable year makes the organisation wealthier, a loss-making year eats into equity.
Van Dijk made 30.000 euro net profit and paid out 10.000 euro of that to the owner. The remaining 20.000 euro stays in the business. On the balance sheet, equity therefore goes from 150.000 to 170.000 euro. If you see in two balance sheets that equity has risen by 20.000 euro, you immediately know where to look for that difference.
There are more bridges. The depreciation in the profit and loss account belongs to the fixed assets on the balance sheet: a machine costing 100,000 euros with a life of five years appears on the balance sheet at 80,000 euros after the first year and produces 20,000 euros of costs in the profit and loss account. The stock on the balance sheet changes through purchases and sales, and the part sold turns up as cost of sales. And the interest charges in the profit and loss account are a direct consequence of the debt capital on the balance sheet. More debt means more interest.
Take the profit and loss account of your own organisation, or of an annual report you can find. Answer five questions:
- What is the gross margin, and how does it compare with last year?
- Which cost items do you estimate to be mainly fixed and which variable?
- What is the operating result, and what is the net margin?
- How much has been depreciated, and how much was invested that year? If more is being depreciated than invested, the organisation is eating into its assets.
- Does the increase in equity on the balance sheet roughly match the profit that has been retained in the business?
Summary
- The profit and loss account works step by step: revenue, less cost of sales gives gross profit, less operating costs gives operating profit, less interest and tax gives net profit.
- Revenue is about invoicing, not about receiving payment. That difference is the heart of the distinction with cash flow.
- The four main cost groups are staff, premises, depreciation and other operating costs.
- Depreciation is a cost without any money leaving the business, and that is why profit can be something other than money in the bank.
- Variable costs move with revenue, fixed costs do not. Direct costs can be assigned to a product or project, indirect costs cannot.
- Gross margin, contribution margin and net margin show at three levels what is left of every euro of turnover. Compare them with last year and with your sector.
- The profit that stays in the business increases the equity on the balance sheet. That is how the two statements hang together.
Why is the operating result often a fairer basis for comparison between two companies than the net profit?
A printing company has 180,000 euros in fixed costs and variable costs of 40 per cent of the selling price. At what turnover does it break even?
A company makes 30,000 euros in net profit and pays 10,000 euros of that out to the owner. What do you see of that on the balance sheet?