


2. The management summary and the key figures block
Most reports are not read from front to back. They are opened, scanned, and after half a minute the reader either puts them aside or carries on. What is on their screen during that half minute determines what happens to your work. That is why a report that works has a fixed structure: the reader knows where to look, and you know while making it which information belongs where.
After this chapter:
- You know the fixed order of a management report, from conclusion to detail.
- You write a management summary of half a page of A4 in three fixed parts.
- You know which figures belong in the key figures block and why each figure needs a benchmark.
- Explain a variance in three sentences: observation, cause, consequence with a choice.
- Decide which detail moves to the appendices and which appendix can be dropped.
The fixed structure
A management report runs from conclusion to detail, not the other way around. At the top is the management summary: what does management need to do with this today? Below that the key figures block: where do we stand? Then the explanation of the variances: why is that, and what does it mean? And at the bottom the appendices: everything that must be available on request but is not needed for the decision.
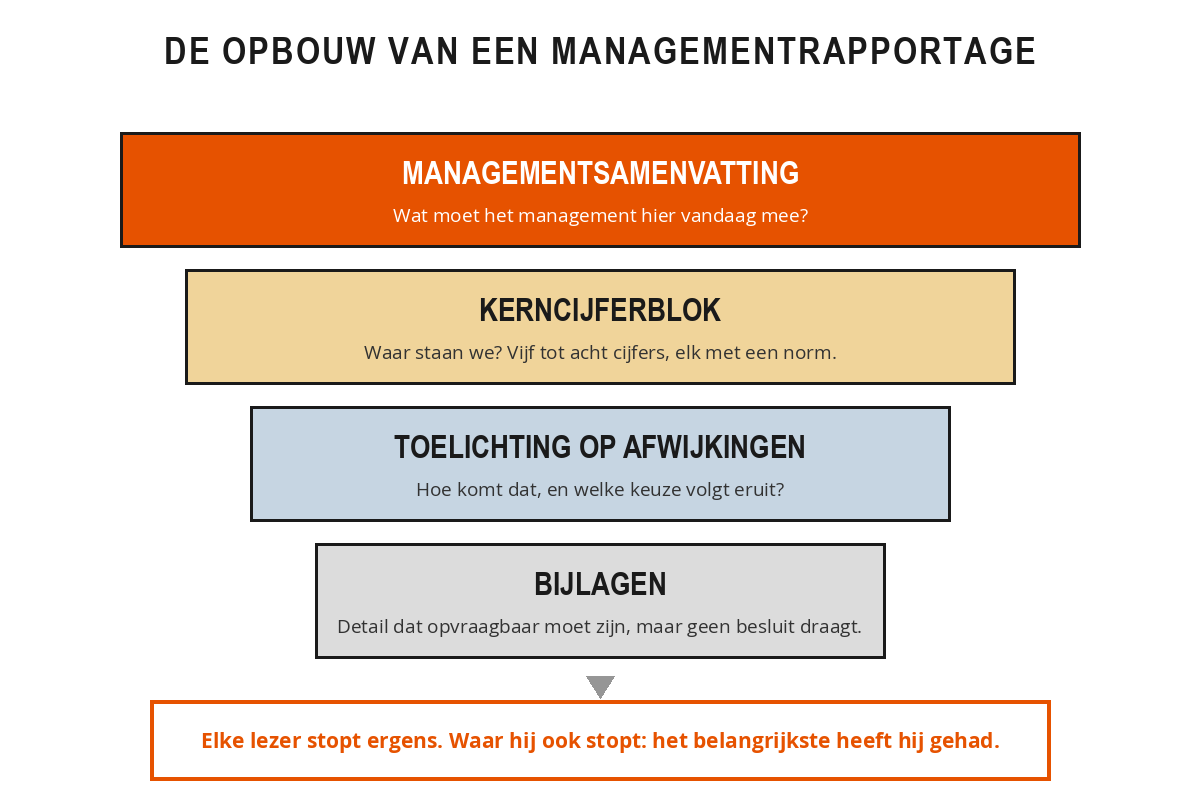
That order has a practical reason. Every reader stops at a different point, and wherever they stop, they will already have had the most important part. The board reads the summary and glances at the key figures. The management team reads the summary and the explanatory notes. The branch manager jumps straight to their own table. Only the accountant and the curious colleague reach the appendices. Turn it around, with the analysis at the back, and everyone drops out before you get to your point.
The management summary in three parts
The management summary comes first and answers, in half a page of A4, the question of what management is expected to do with this today. It is not an introduction and not a list of what follows further on. It is your conclusion, placed at the front instead of at the back. The structure is fixed, which makes it both quick to write and quick to read.
First the assessment of the period. One sentence saying how the period went compared with the norm. "The margin is 1,8 percentage points behind budget, turnover is on plan." No run-up, no caveats.
Then the two or three most important variances. For each variance, the amount, the cause in one sentence and the expected effect on the rest of the year. Two or three, not eight. A summary that briefly runs through every item has become a jumble of figures in text form; the rest you leave to the key figures block and the explanation.
And finally the decision points. What is being asked of the management team, with a name and a deadline attached. Without this part, your summary remains a notification, and there is nothing to decide about a notification.
Weak: "In September, turnover came to 2,4 million euros. Staff costs rose. The margin was under pressure."
Strong: "The gross margin comes out at 31 per cent against 33 per cent budgeted; turnover is on plan at 2,4 million. The cause is the hired-in staff on the vacancies in South and North, which is 84.000 euros over budget. If policy remains unchanged, that will rise to around 150.000 euros by year-end. Decision requested: convert the vacancy in South to secondment, or continue with hired-in staff until December. Owner: HR, decision before 15 October."
The weak version contains three true sentences that nobody can act on. The strong version is just as long and ends with a choice and a date.
You write the summary last and put it first. Only once the rest is finished do you know what the core is. If you struggle to write it, that is a signal: usually the analysis is not yet complete.
The key figures block
The key figures block is the fixed set of five to eight indicators that you show every period in the same place, in the same order and with the same definition. At a glance it answers the question of where the organisation stands. Three rules keep that block usable.
Each figure sits alongside a benchmark, because a number without a comparison is not management information. That benchmark is the budget, the previous period or the annual plan, but you state which one it is. You show the variance both in euros and as a percentage, so that the reader can weigh up the size: 12 per cent on an item of 30,000 euros is something different from 2 per cent on an item of 4 million. And the composition is fixed: if a definition changes, you report that explicitly beneath the block, because otherwise your reader will unwittingly be comparing apples with pears.
The key figures block of Ilse, the installation company from chapter 1, comes to six lines after cleaning up. Turnover: 2,4 million against 2,4 million budgeted, on plan. Gross margin: 31,0 per cent against 33,0 per cent, 2,0 percentage points below norm. Staff costs: 1.439.000 against 1.355.000 budgeted, 84.000 euros (6,2 per cent) above norm. Chargeability: 71 per cent against a norm of 75 per cent. Outstanding receivables over sixty days: 218.000 euros against a ceiling of 150.000. Order book: 5,1 million against 4,8 million last year.
Six lines, each with a benchmark alongside it. Within five seconds the reader sees that turnover is not the problem and the margin is. The old version had nineteen lines without benchmarks, and reaching that same conclusion took a quarter of an hour.
Explanation of variances
The explanation is the only part in which you, as the author, give an explicit assessment. For each relevant difference you explain where it comes from, what it means for the rest of the year and which choice follows from it.
Not every variance deserves a comment. A workable threshold combines a percentage and an amount: a variance is explained if it is greater than 5 per cent of the item and greater than an absolute minimum that suits the size of your organisation. Both conditions apply at the same time, otherwise you fill pages with small items that happen to show a large swing. In addition, you explain what the reader expects to see, even when the figure comes out neatly on budget: if an item that was well out of line last month now falls exactly within the norm, the management team wants to know whether that is down to the measure taken or to chance.
A usable explanation fits into three sentences and always follows the same order. First the observation: the variance in euros and percentages, with the item it belongs to, and not the whole table all over again. Then the cause: what has actually happened, and is it a one-off or structural? An additional charge from the energy supplier calls for a different conversation than a rate that is permanently higher. And finally the consequence with a choice: what does this mean for the rest of the year, which course of action is on the table, who is the owner and when will the decision be taken.
An explanation that begins with "due to various causes" or "as a result of higher costs" is not an explanation. If you do not know the cause, write down that you are still looking into it and on what date you will deliver the answer.
Appendices as back-up
The appendix structure is the fixed, numbered ordering of everything that is not needed for the decision but must still be available on request. It is the place where you park detail without throwing it away, and that saves discussion: you do not have to defend a table in the main text, nor do you have to delete it.
Three agreements keep that fallback healthy. Each appendix has a number that you refer to from the main text, so that nobody has to search. Each appendix has an owner who can explain the content. And each appendix is included in an annual clean-up round: whatever has not been requested by anyone for a year disappears. In Ilse's case, seven of the eleven appendices were scrapped this way, including a breakdown that had been produced every month since 2019 for a colleague who was no longer employed there.
Take the last report you delivered.
- Count how many figures appear on the first two pages, and which indicators you are left with if you may show no more than eight.
- Write down your judgement of the past period in a single sentence, without listing figures.
- Formulate the decision you are asking the management team for, with owner and deadline.
- Note behind each appendix who has asked for it over the past year, or "nobody".
Then compare your answers with what actually appears on page 1. The difference is your list of points to improve.
Summary
- A report runs from conclusion to detail: summary, key figures block, explanation, appendices.
- Every reader stops at a different point; wherever they stop, they will have had the most important part.
- The management summary is half a side of A4 in three parts: the conclusion, two or three deviations, and the decision points with a name and a deadline.
- Without a decision point, the summary remains a notification.
- The key figures block contains five to eight indicators, each with a target, the variance in euros and in percentages, and a fixed composition.
- An explanation fits into three sentences: observation, cause, consequence with a choice.
- Appendices are given a number, an owner and an annual clean-up round.
Which three parts belong in a management summary according to this chapter?
Why is there a norm next to every figure in the key figures block?
One item deviates 9 per cent from budget, but in euros that is 1,800 out of a total of 4 million. What do you do?