


1. Which figures do you track as a manager
Most managers do not get too few figures, but too many. The monthly report runs to fourteen tabs, the system effortlessly churns out thirty charts, and the screen in the corridor shows a dashboard that nobody reads any more. Managing by numbers therefore does not start with measuring, but with choosing. Which handful of figures really says something about the health of your department, and which ones can you safely ignore?
After this chapter:
- You know what makes a figure a KPI, and why thirty KPIs amount to none.
- You know the four perspectives from which you look at your department.
- Can you use three questions to separate figures that steer from figures that merely fill.
- You recognise the difference between a leading and a lagging indicator.
- You know what a KPI definition sheet must contain before you start using a figure.
From measuring everything to following a few figures
KPI stands for key performance indicator. Every word counts. Indicator: it is an indication, not a truth. Performance: it says something about how your department is doing, not about how busy you are. And key: this figure really matters. If it scores badly, you have a problem. Anything that does not meet that threshold is not a KPI but background information.
In practice that distinction quickly disappears. In many organisations every figure on the dashboard is called a KPI, even when thirty of them are on one screen. But if everything is critical, nothing is critical any more. A workable rule of thumb: a department has three to five real KPIs. Any more and the conversation fragments. Any fewer and you miss a blind spot.
Take "number of calls this week". That is a measurement figure. Interesting perhaps, but what do you do with it? Turn it into "average waiting time on the phone", add a target of no more than thirty seconds, and you have something you can steer on. Everyone now knows what good looks like and when action is needed. The difference between a figure and a KPI lies in the target, the direction and the link to a goal.
Four windows on your department
If you manage on money alone, in the long run you lose the customer, the process or the team. A department can look financially fine while the customers walk away, the work grinds to a halt and the best employees quietly apply elsewhere. That is why you look from four perspectives, each with its own key question.
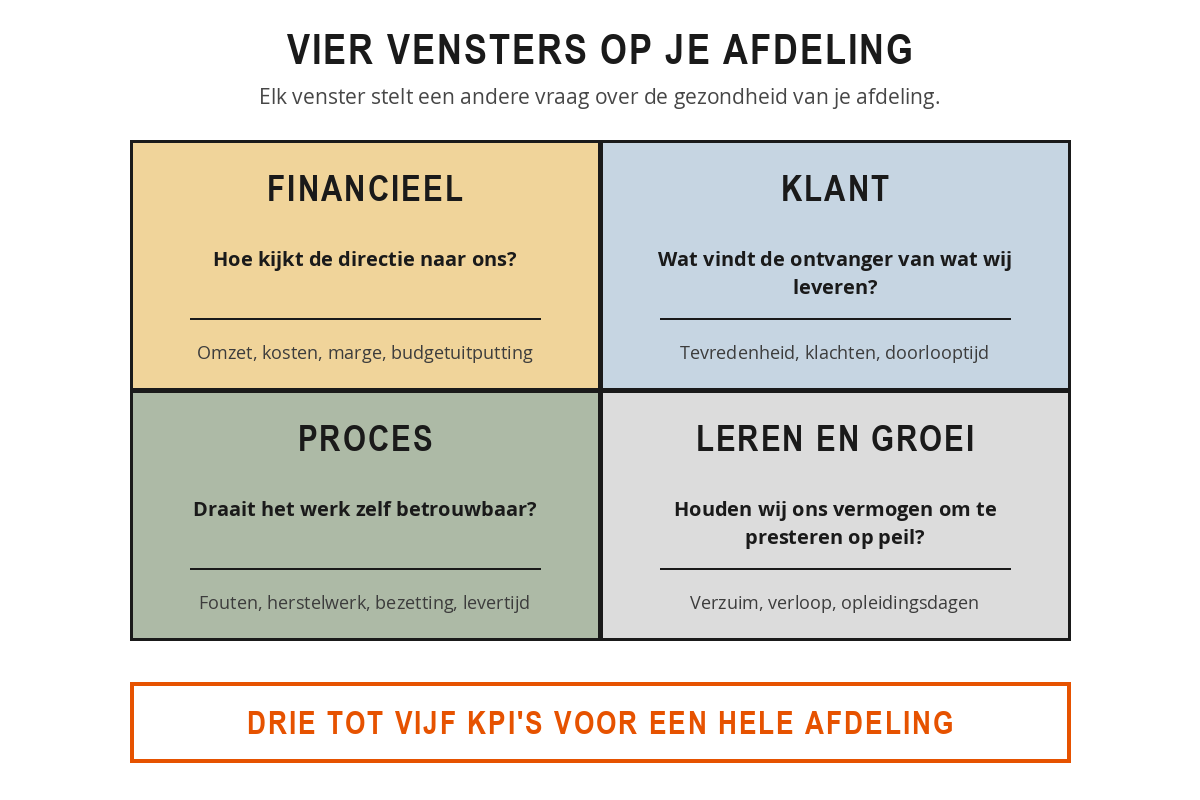
The financial perspective looks at the money flows that affect your department: revenue, costs, margin, budget utilisation. The key question is how the board looks at your department. Even a department without revenue of its own has financial figures, for example the cost per application processed or the extent to which the budget has been used realistically.
The customer perspective looks at how your department is experienced by those you serve: satisfaction score, complaints per month, lead time for customer questions, the percentage that is right first time. Customer is broader than external customer. For an HR department the managers are the customer, for the helpdesk it is the colleague reporting an issue.
The process perspective looks at the engine under the bonnet: lead time, error rate, rework, occupancy rate. Where do you need to excel in order to serve the customer and the finances? These figures often run ahead of the rest: if the error rate rises, the complaints and the repair costs follow a few weeks later.
The learning and growth perspective is the most neglected and at the same time the engine beneath the other three: absenteeism, staff turnover, trained employees, new skills within the team. A department that ignores this window is eating into its own future. Two years later the other three are under pressure and correcting course has become expensive.
The four hang together. If you invest in training, errors fall, which makes customers more satisfied and brings down the cost of putting things right. That chain effect makes the model more than four boxes on a sheet of paper.
Sanne leads a customer service team of twelve people. She started with a list of fourteen figures she wanted to track. After an afternoon with her two team leaders, four were left: average handling time and the percentage that is right first time (process), customer satisfaction after handling (customer) and the absence rate (learning and growth). Her manager fills in the financial perspective at department level. Since that choice, the weekly meeting does not take any longer, but it does produce something: four figures, four conversations, three agreements at the end.
Three questions for sifting
For each perspective you will come up with five to ten possible indicators. To get back to three or five, ask three questions about each figure.
- Can you influence it? If your team cannot move this figure through its own work, it is not a steering instrument. The exchange rate and the weather matter, but there is nothing you can do about them.
- Does it tell you anything about what lies ahead? Last month's turnover is an outcome. The number of quotations this week says something about turnover two months from now. A good set of figures has some of both.
- Can you have a sensible conversation about it? A figure that nobody understands, or that only becomes visible after three quarters, provides no steering. The best indicators are the ones you can simply talk about on a Monday morning.
Leading and lagging
That second point deserves a name of its own, because you come across the English terms everywhere. A lagging indicator measures something that has already happened: last month's turnover, satisfaction over the past quarter, absenteeism over the year. Hard and reliable, because it measures a completed reality. The drawback: by the time you see it, you can no longer change it. You are looking in the rear-view mirror.
A leading indicator measures something that will lead to that result later on. The number of quotations sent this week predicts turnover two months from now. The number of training days per employee predicts the error rate six months from now. The number of one-to-one conversations you hold predicts staff turnover a year from now.
The difficulty lies in the combination. Anyone who steers only on lagging indicators is always too late. Anyone who steers only on leading indicators can never be sure their predictors are right. Hence two questions you train yourself to ask. For every leading figure: what is this a predictor of? And for every lagging figure: which actions this week determine that figure later on?
Ruben leads a sales team of five. His target is 90.000 euro in revenue per month. In March it came to 84.000 euro, in April 82.000 euro. It was not until mid-May that he spotted the pattern, and by then the quarter was over. He put one leading indicator alongside it: the number of quotations sent per week, with a target of twelve. It goes up on the board on Friday afternoon. In the first week of June there were seven. He had that conversation on the Friday, not eight weeks later when the revenue figures came in. Two months' difference, the same problem.
Count how many leading and how many lagging indicators appear on your current report. In practice it is almost always only lagging ones: revenue, margin, absenteeism, satisfaction. Deliberately add two leading ones and your report changes from an accountability document into a steering instrument.
Defining what you measure
A KPI that exists only as a slogan, "we steer on customer satisfaction", is not yet a KPI. As long as it is not established how you measure, what the target is and who owns it, the discussion starts again every month: what was it we counted again? That is why you record one A4 per figure, the KPI definition sheet, setting out the name in one sentence, the formula including numerator and denominator, the source, the owner, the measurement frequency, the target, what you agree to do in the event of a deviation, and whether it is leading or lagging.
That sounds bureaucratic for a single sheet of paper, but it settles the hardest conversation in advance. Especially that one line about the action to take when there is a deviation: if you agree now what happens as soon as the waiting time exceeds the norm, you don't have to work it out at the moment things go wrong. Never fill in the sheet on your own. Do it together with the people who do the work, and you will get a better formula, a more realistic norm and a figure that no longer comes as a surprise on the dashboard.
Take a blank sheet and divide it into four boxes, one per perspective. For each box, fill in:
- Three figures you could measure for your department.
- The best candidate of those three.
- A score from 1 to 5 on each of the three screening questions: can you influence it, is it predictive, is it open to discussion.
Then choose three to five indicators across the four boxes. If a perspective is missing, note whether that is a deliberate choice or a blind spot. Finally, work out one of those indicators on a definition sheet and put it to a colleague with the question: what would you end up arguing about?
Summary
- A KPI is critical: if it scores badly, you have a problem. Three to five per department, the rest is background.
- A figure only becomes a KPI through a target, a direction and a link to an objective.
- Four perspectives keep your view complete: financial, customer, process, and learning and growth.
- Sift with three questions: can you influence it, does it say something about what is coming, and can you have a conversation about it?
- Lagging measures what has happened, leading predicts what is coming. You need both.
- Record for each KPI: formula, source, owner, frequency, target, action in the event of a deviation, and type.
A department's dashboard shows thirty figures, all of them called KPIs. What is the problem with that?
Ruben steers his sales team on last month's turnover. Why does he place the number of quotations sent per week alongside it?
A team leader wants to start steering on the euro exchange rate, because it affects his department's purchase prices. What does this chapter say about that?