


Introduction
Every month the report arrives. Fourteen tabs, two hundred figures and half an hour in the diary to go through it. You read what it says, you nod at the column that has turned red, and a week later nothing has changed. Not because you don't understand the figures, but because the translation is missing: from a number on a screen to a decision you take on Monday.
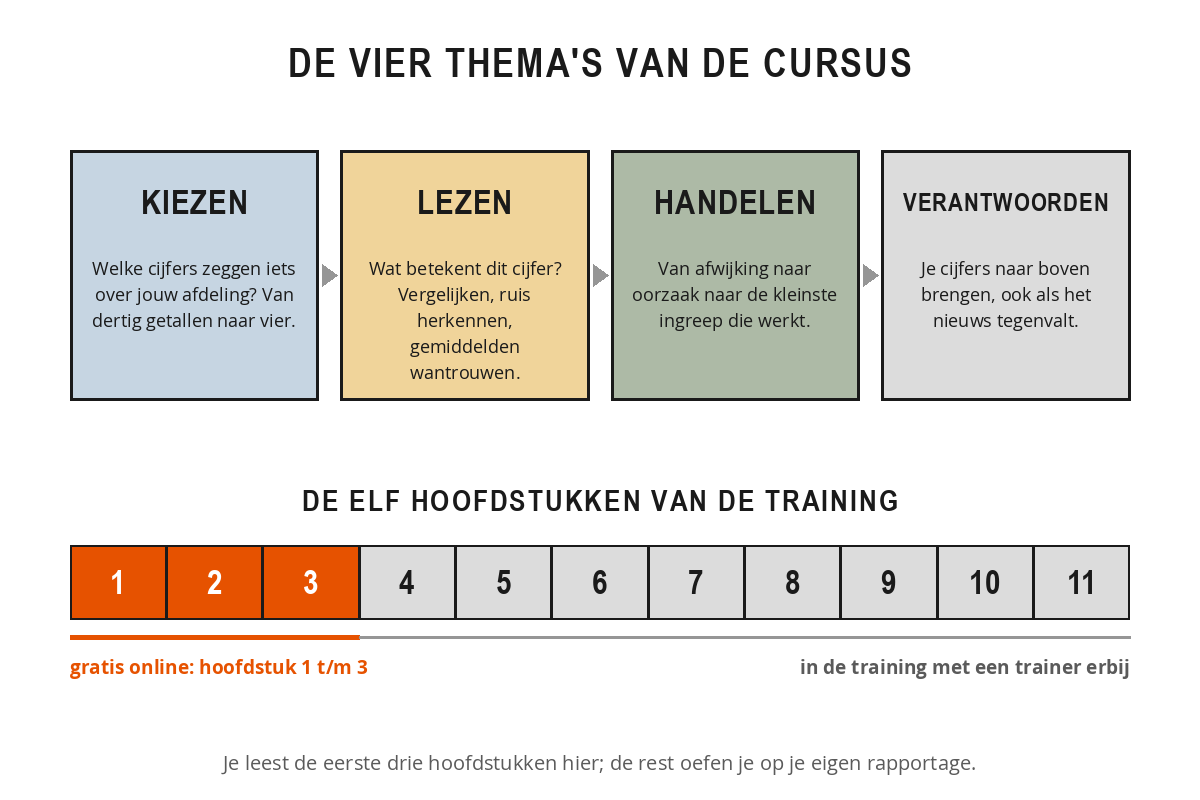
This free course contains the first three chapters: the orange part of the bar above. At the bottom of chapter 3 you will find the full course.
What you will learn
You choose the handful of figures you really manage by as a manager, spread across the four windows onto your department: money, customer, process and team. You learn to read a variance using four questions, and you learn to recognise the three pitfalls most managers fall into: the average that hides the spread, the decimal place that suggests certainty, and the single outlier that is mistaken for a trend. You then trace a variance back to the cause you can actually do something about and choose the smallest intervention that works. The common thread: measuring only becomes managing when a decision follows from it.
How the course is structured
The course follows four themes that build on one another. You start with choosing: which figures actually say something about your department? Then comes reading: what does this figure actually mean? After that acting: what do you do with a variance, and with your team? And you finish with accounting: how to raise difficult figures, even when the news is disappointing. Each chapter has theory, a diagram, examples from practice and an exercise you apply to your own reporting.
Practical tips for use
- Put your own department's latest report next to it. The exercises only work with real figures.
- Don't read it all in one go. One chapter a week, with time to try things out, gets you further.
- For each chapter, choose one figure from your own work and apply the content to it.
- Start small. Two good indicators that you discuss every month are worth more than a dashboard with thirty tiles.
- Do the exercises together with someone from your team. That produces better formulas and saves discussion afterwards.
Each chapter ends with a short knowledge check of three questions: answer them correctly to mark the chapter as completed. Your progress is saved automatically in your browser.
Enjoy the read, and above all: enjoy the first decision that comes out of your own figures.